在Google Earth上绘制震源球
文章目录
Google Earth可以方便地放大缩小区域范围。将震源球画在Google Earth上可以方便地 查看不同地区地震的震源机制。本文介绍如何把震源球显示在Google Earth上。
原理其实很简单,
- 利用 obspy.imaging.beachball 绘制震源球并保存为PNG格式的图片
- 利用 simplekml 生成KML文件,其中包含 一堆点,每个点对应一个地震,点的图标设置为地震对应的震源球图片即可
本文示例所使用的震源机制文件 catalog.dat 的格式为:
# origin latitude longitude depth mag strike dip rake
20161223172502 36.7282 141.8532  39.67 4.9 4 53 -97
20161228123849 36.7202 140.5742  10.84 5.9 307 52 -118
20161230200827 37.3550 141.4098  27.35 5.1 21 56 -82
以下为 Python 脚本,在 Python 3.6、ObsPy 1.1.0 和 simplekml 1.3.0 下测试通过。
#!/usr/bin/env python
# -*- coding: utf-8 -*-
import os
import matplotlib.pyplot as plt

import simplekml
from obspy.imaging.beachball import beachball

beachball_dir = "beachballs"

if not os.path.exists(beachball_dir):
    os.mkdir(beachball_dir)

kml = simplekml.Kml()
with open("catalog.dat") as f:
    for line in f:
        # skip comment lines
        if line.startswith('#'):
            continue

        items = line.split()
        event_id = items[0]
        latitude, longitude, depth, magnitude, strike, dip, rake = map(
            float, items[1:])

        # plot beachballs and save as PNG file
        outfile = "{}/{}.png".format(beachball_dir, event_id)
        beachball([strike, dip, rake], outfile=outfile)
        # must close to avoid opening too many figures one time
        plt.close()

        # add points to KML file
        point = kml.newpoint(name=None)
        point.coords = [(longitude, latitude)]
        point.description = event_id
        # style.iconstyle.scale controls the size of beachball
        point.style.iconstyle.scale = 1.5
        point.style.iconstyle.icon.href = outfile
    kml.save("beachballs.kml")
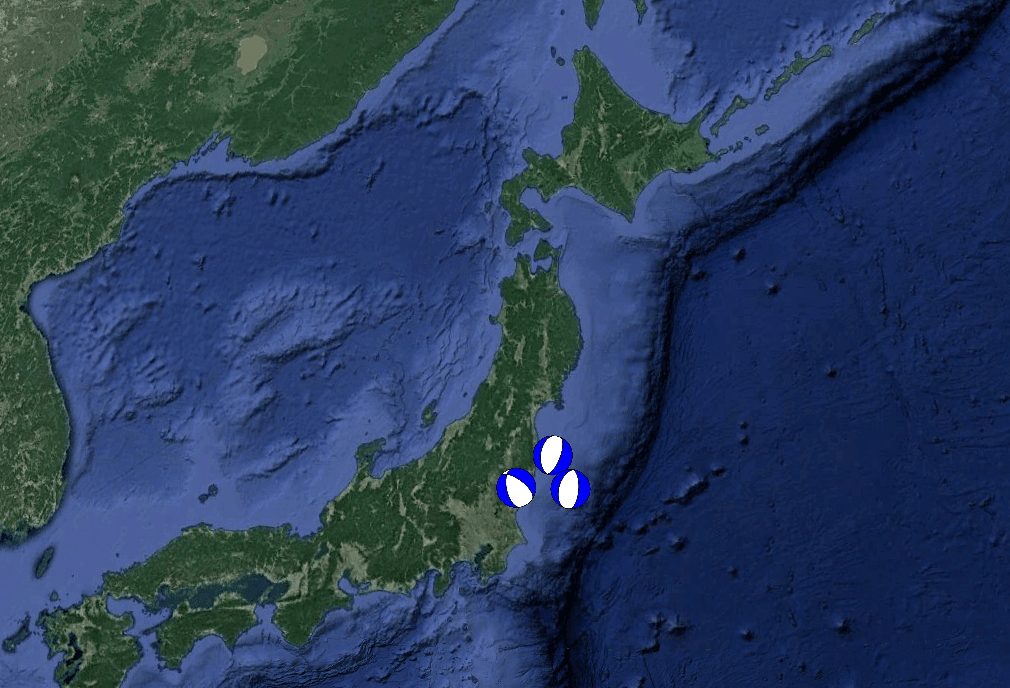
执行脚本会生成KML文件 beachballs.kml ,用Google Earth打开KML文件,效果如下图
所示。
文章作者 SeisMan
上次更新 2018-03-03